Employee performance and engagement
On this page
Indicators of sector performance
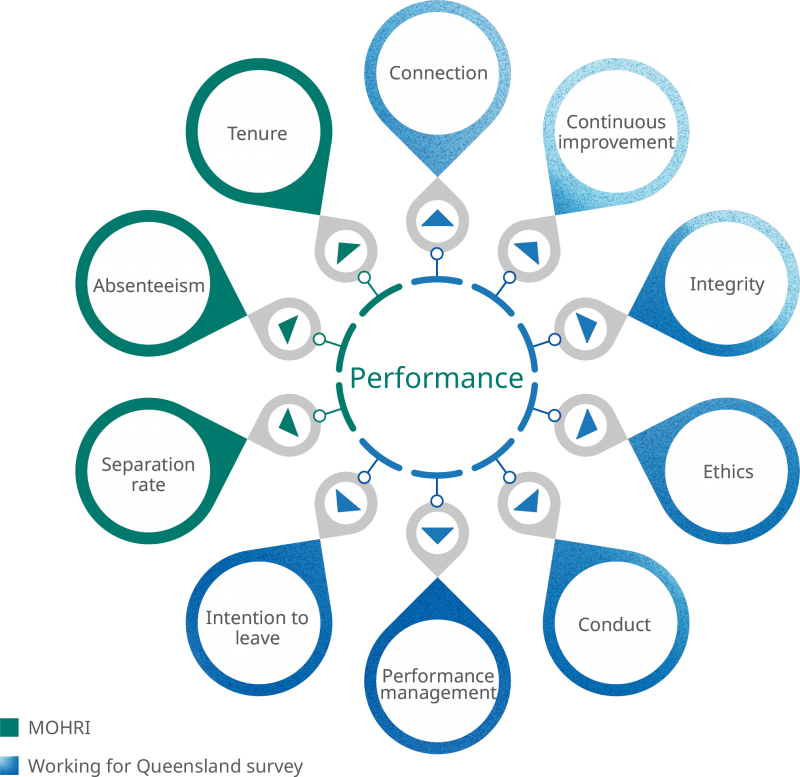
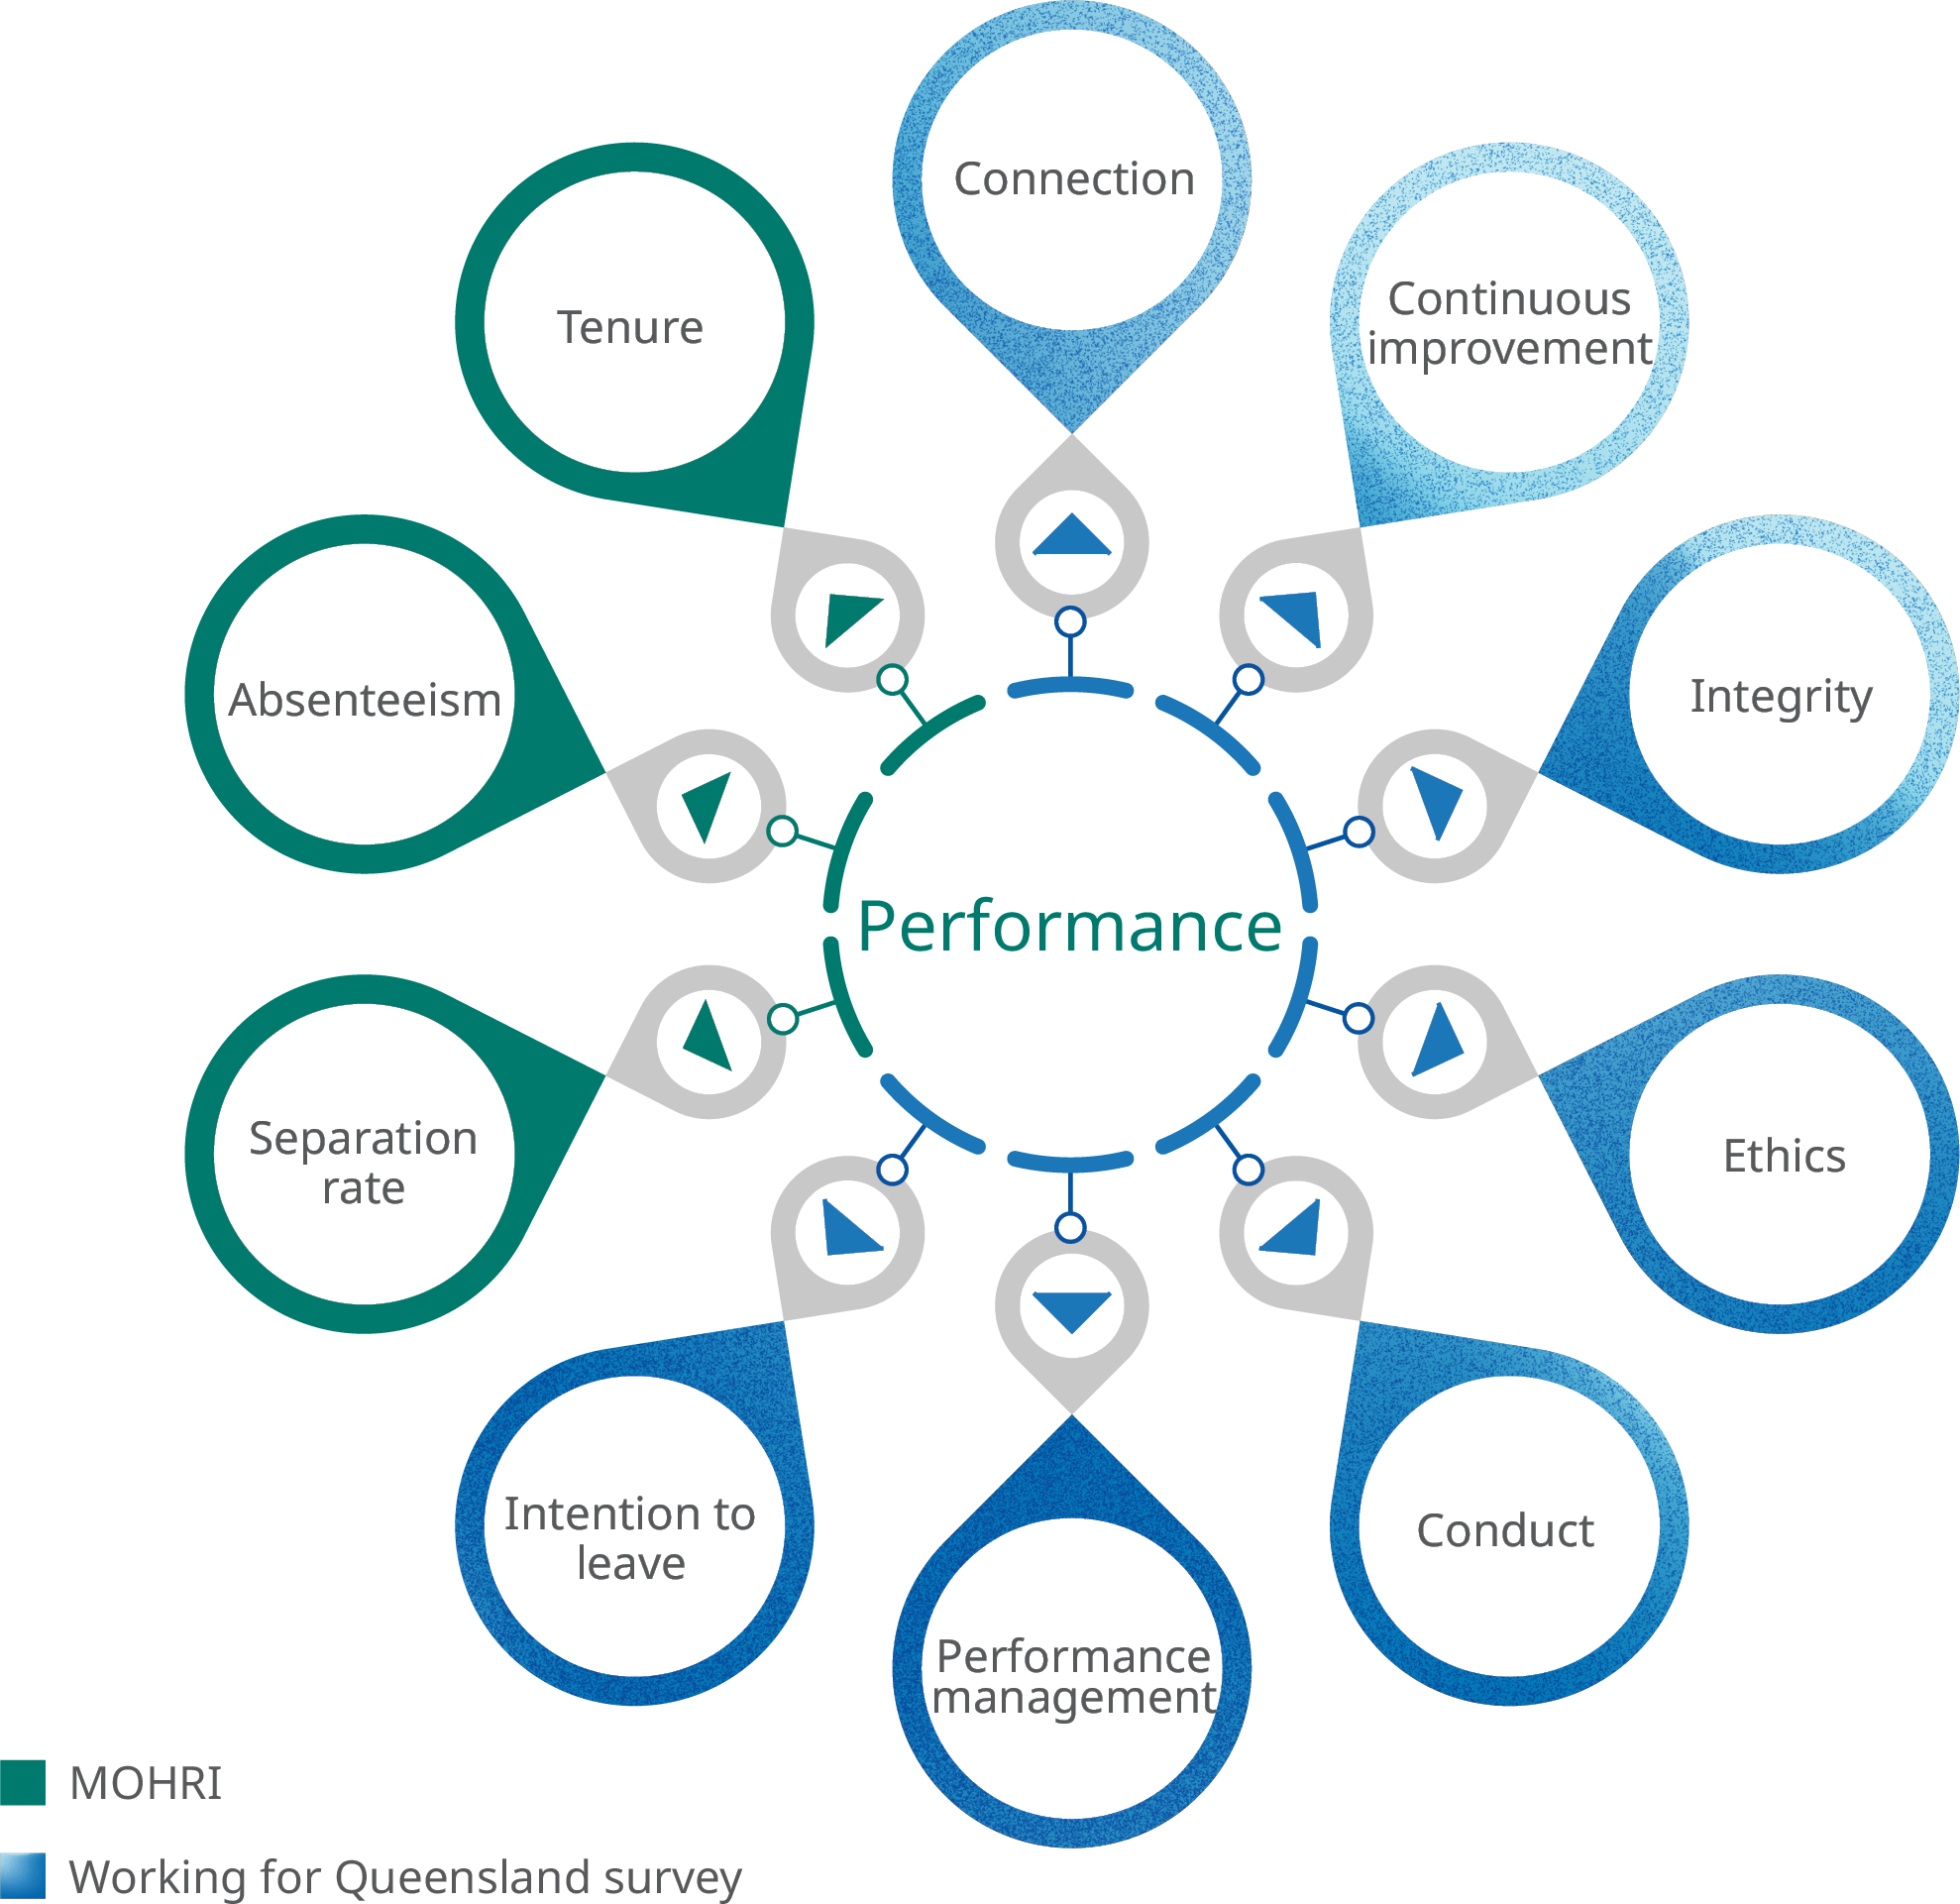
The performance of the Queensland public sector is measured through multiple data sets—including MOHRI collected from payroll data and the annual Working for Queensland (WfQ) employee opinion survey results.
These data sets provide powerful lead and lag indicators of workplace performance.
The WfQ survey captures information on performance relating to attitudes and sentiments that are common in the workplace with respect to misconduct and unethical behaviour. The survey also captures data on the experience of negative behaviours including workplace bullying, sexual harassment, racism and discrimination. Data on intention to leave the organisation is also collected.
While the attitudes and sentiment captured through the WfQ survey provide lead or predictive indicators of behaviour and performance, MOHRI data captures lag performance measures. Absenteeism and turnover can be examples of employee behaviour in response to low levels of, for example, engagement.
Continuous improvement
Continuous improvement is a critical performance measure and is directly related to the effectiveness and efficiency of the services delivered to the people of Queensland.
This data has remained stable between 2022 and 2024 and encompasses a range of themes.
- 63% proactively seek better and new ways to do their job often and always.
- 67% help coworkers learn new skills and share job knowledge often and always.
- 60% help coworkers that have too much work to do often and always.
- 60% work with colleagues to identify better practice often and always.
Source: WfQ 2024.
Leadership level has a significant impact on perceptions of continuous improvement.
| Never and Rarely | Once in a while, Some of the time and Fairly often | Often and Always | |
|---|---|---|---|
| Individual contributor | |||
| I proactively seek new and better ways of doing my job. | 3% | 37% | 60% |
| I help co-workers learn new skills or share job knowledge. | 2% | 35% | 62% |
| I help co-workers who have too much to do. | 3% | 42% | 55% |
| I work with colleagues to identify better practice. | 4% | 42% | 54% |
| Team leader | |||
| I proactively seek new and better ways of doing my job. | 2% | 33% | 65% |
| I help co-workers learn new skills or share job knowledge. | 1% | 24% | 76% |
| I help co-workers who have too much to do. | 1% | 33% | 66% |
| I work with colleagues to identify better practice. | 1% | 31% | 67% |
| Program leader | |||
| I proactively seek new and better ways of doing my job. | 1% | 23% | 76% |
| I help co-workers learn new skills or share job knowledge. | 1% | 20% | 80% |
| I help co-workers who have too much to do. | 1% | 30% | 69% |
| I work with colleagues to identify better practice. | 1% | 24% | 75% |
| Executive and Chief Executive | |||
| I proactively seek new and better ways of doing my job. | 1% | 12% | 87% |
| I help co-workers learn new skills or share job knowledge. | 1% | 11% | 88% |
| I help co-workers who have too much to do. | 1% | 21% | 78% |
| I work with colleagues to identify better practice. | 1% | 13% | 87% |
Source: WfQ 2024.
Case study: Continuous improvement in action
Field management of the Great Barrier Reef by the Queensland and Australian Governments through the Queensland Parks and Wildlife Service and the Great Barrier Reef Marine Park Authority has been quoted as a significant contributor to protecting the resilience of the Reef by UNESCO (UNESCO World Heritage Centre - State of Conservation (SOC 2024) Great Barrier Reef (Australia). The most effective way for infield management to deliver tangible outcomes is to be able to reach the reef with an agile and fit-for-purpose fleet, staffed by a highly trained workforce.
The creation of this fleet is the result of a 46-year collaboration through the Great Barrier Reef Intergovernmental Agreement that provides for a partnership between the Queensland and Australian Governments that includes the Reef Joint Field Management Program (the Program).
The Program delivers infield conservation actions, monitoring, compliance, world class visitor experiences and incident response. With unwavering vision from the Programs Strategy Group (made up of State and Commonwealth executives), the Maritime Operations team have developed and delivered a highly capable vessel fleet operated by a dedicated workforce.
The ability to be present in remote locations across the Great Barrier Reef, means that the team is available regularly to respond to maritime emergencies and rescues, saving the reef and saving lives.
Recruitment, selection, training and maintaining skills is vital as they may be called upon at any time for community safety responses including natural disasters and rescues. Further, with the volume of work undertaken at sea, the Maritime Operations Team works across the Program to maintain the fleet and to maintain high capability standards to deal with the many variables that can occur when working in the marine environment.
The fleet of 21 vessels spent 1754 days at sea in 2024/25 delivering field management including extended remote operations across the entire World Heritage Area.
The committed team work tirelessly to deliver outcomes for the Great Barrier Reef and the community that relies on it for their livelihoods and their recreation.
They are highly trained, motivated and experienced mariners with a strong sense of community responsibility, undertaking sometimes complex rescues that have changed people’s lives.
Crews have been recognised two years in a row at the Departmental Safety Awards with the crew of Reef Resilience recognised in 2024 for their efforts, exceptional skills and positive attitude during the rescue of two people from a life raft in dark and rough conditions after their yacht caught fire. Then, in late 2024, the crew of Tamoya 2 took out the Director General’s Choice Award for the rescue of two fishers offshore from Mackay.
Connection with work
Levels of connection with the work a person does can be determined by several factors—the extent to which the job inspires, energises or makes the person feel proud of the work they do.
Measuring these factors is challenging, as they are influenced by organisational culture and to an extent depend on the types of tasks the individual must complete daily.
The connection with work data is asked on a seven-point frequency scale—from never and rarely to often and always. The WfQ items that measure connection with work include respondents feeling energised by their work, inspired to do their best and proud of their work.
- 32% feel energised by their work often and always – 20% fairly often and 25% some of the time
- 50% are inspired by their job to do their best often and always – 21% fairly often and 15% some of the time
- 63% are proud of the work they do often and always – 18% fairly often and 11% some of the time.
Source: WfQ 2024.
Where people perform frontline work, the extent to which they feel energised by work decreases to 25% often and always.
Where people work in program design and program management the extent to which they feel energised by their work increases to 41% often and always.
The nature of the work itself significantly impacts the connection and, particularly, the feeling of being energised by work.
Seniority has a significant impact on connection.
| Never and Rarely | Once in a while, Some of the time and fairly often | Often and always | |
|---|---|---|---|
| Individual contributor | |||
| I feel energised by my work. | 15% | 56% | 29% |
| My job inspires me to do my best. | 8% | 44% | 47% |
| I am proud of the work that I do. | 4% | 35% | 60% |
| Team leader | |||
| I feel energised by my work. | 12% | 57% | 31% |
| My job inspires me to do my best. | 7% | 44% | 49% |
| I am proud of the work that I do. | 3% | 32% | 65% |
| Program leader | |||
| I feel energised by my work. | 7% | 49% | 44% |
| My job inspires me to do my best. | 4% | 36% | 60% |
| I am proud of the work that I do. | 2% | 24% | 74% |
| Executive and Chief Executive | |||
| I feel energised by my work. | 3% | 30% | 67% |
| My job inspires me to do my best. | 2% | 18% | 79% |
| I am proud of the work that I do. | 1% | 12% | 87% |
Source: WfQ 2024.
Case study: Connection in action
The ongoing issue of youth crime in Queensland demonstrates the need for interventions to support at-risk children and young people.
The Youth Development Partnership Fund, established in 2023, emerged as a collaborative initiative between the Department of Sport, Racing and Olympic and Paralympic Games (the Department) and the Queensland Police Service, aiming to support projects that use sport and recreation as a tool for crime prevention and diversion among vulnerable young people.
Evidence suggests that engaging in physical activities can enhance both physical and mental health, which is particularly beneficial for youth prone to offending behaviours. Using sport as an intervention not only helps in the improvement of participants' health but also imparts vital life skills, contributing to the reduction of crime and anti-social tendencies.
To date, the Youth Development Partnership Fund has supported 29 projects in various stages of delivery to a total of $3.857 million. Some examples projects and outcomes include:
- R.E.A.P the Rewards program, a touch football program in Logan, engages young people who have been disengaged in education for a considerable period and are participating in offending behaviour.
- In its first trial, the touch football program has demonstrated great success, with more than half the participants ceasing to offend during and for the four months following the program.
- The positive outcomes extend beyond reduction in offending behaviour, with one participant securing employment, and another referred to the National Rugby League RISE program.
- Compared to the four months prior, all of the fifteen participants showed a decrease in their level of offending during the program and the subsequent four months.
- Eight participants ceased offending entirely, while the remaining six reduced both the severity and volume of their offences. This program has proven to be a cause for change and an effective tool in diverting young individuals away from the cycle of offending using sport.
- Police and Community Youth Clubs (PCYC) South Burnett delivered free, inclusive, non-competitive basketball events for at risk 12–17‐year‐olds.
- During the school holidays, participants competed in the South West Swish Basketball Competition, where they finished as runners-up. Participants were also invited to and attended the NRL HOGS event, where they played basketball against NRL players and shared breakfast with them.
- One female participant has received two school scholarship offers and an invitation to join the NBL 1 Dolphins team, with ongoing discussions between families and relevant parties.
- One female participant has been invited to represent in the under 16’s Queensland competition, highlighting the growing competitive potential within the program.