Sector workforce profile
On this page
Overview
- The whole-of-sector grew by 11,702.64 FTE – an annual increase of 4.75%
- The health workforce grew by 6,546.30 FTE or 6.48%
- The education workforce grew by 513.66 FTE or 0.64%
- The rest of sector grew by 4,642.68 FTE or 7.13%.
The whole-of sector grew from 232,553.84 FTE in March 2020 to 258,012.13 FTE in March 2024. This is an increase of 25,458.29 FTE in five years.
Over the 12 months from March 2023 to March 2024, the whole-of-sector grew by 11,702.64 FTE, a 4.75% increase.
| March 2023 FTE and FTE % of total workforce/sector | March 2024 FTE and FTE % of total workforce/sector | FTE variance 2023 to 2024 | % FTE variance 2023 to 2024 | |||
|---|---|---|---|---|---|---|
| Education1 workforce | 80,155.42 | 32.54% | 80,669.08 | 31.27% | 513.66 | 0.64% |
| Health workforce | 101,037.28 | 41.02% | 107,583.58 | 41.70% | 6,546.3 | 6.48% |
| Rest of sector | 65,116.79 | 26.44% | 69,759.47 | 27.04% | 4,642.68 | 7.13% |
| Whole of sector | 246,309.49 | 258,012.13 | 11,702.64 | 4.75% | ||
1 Education sector includes TAFE Queensland.
Source: MOHRI March 2023 and March 2024.
As a proportion of the total sector, the health workforce grew from 39.92% to 41.70% of the total sector, over five years. Over the same period, the education workforce shrank from 33.60% to 31.27%. As in other jurisdictions, the Queensland education sector continues to struggle with teacher shortages.
The rest of the sector, which includes all other public sector departments, initially reduced proportionately between March 2020 and 2022, and then expanded in March 2023 and 2024. The Queensland Government response to the COVID-19 pandemic and the introduction of savings measures were the main drivers of the sudden reduction between March 2020 and 2022.
| FTE numbers | Mar 2020 | Mar 2021 | Mar 2022 | Mar 203 | Mar 2024 |
|---|---|---|---|---|---|
| Education workforce | 78,146.91 | 79,032.47 | 79,444.35 | 80,155.42 | 80,669.08 |
| Health workforce | 92,837.32 | 94,806.68 | 99,482.68 | 101,037.28 | 107,583.58 |
| Rest of sector | 61,569.61 | 61,608.57 | 62,841.84 | 65,116.79 | 69,759.47 |
Source: MOHRI 2020–2024.
Workforce size by agency
Machinery of government (MoG) changes are common within the public sector context.
These changes occur when the government of the day changes Ministerial portfolios to ensure they align with government’s objectives and priorities. Public sector departments change in composition to reflect the updated portfolios, and to ensure they align with government’s objectives and priorities. Government’s priorities are:
- Good jobs: Good, secure jobs in traditional and emerging industries
- Better services: Deliver even better services right across Queensland
- Great lifestyle: Protect and enhance our Queensland lifestyle as we grow
MoG changes impact the size of a department if functions are transferred into it or out to another department. Such changes may lead to the renaming of a department, abolishment of departments or establishment of new ones. Three MoG changes occurred between March 2020 and March 2024. Two of these MoG changes occurred in 2023.
As such, direct comparisons of data at a department or agency level should be treated with caution.
The table below shows the changes in FTE numbers of different departments and other entities in the last five years.
| Agency | Mar 2020 | Mar 2021 | Mar 2022 | Mar 2023 | Mar 2024 |
|---|---|---|---|---|---|
| Department of Agriculture and Fisheries (7) | 2,124.06 | 2,000.46 | 2,040.05 | 2,091.22 | 2,148.74 |
| Department of Child Safety, Seniors and Disability Services (2) (3) (7) | 5,342.36 | ||||
| Department of Education (3) (7) | 74,101.34 | 74,970.06 | 75,219.69 | 75,821.99 | 76,228.04 |
| Department of Employment, Small Business and Training (1) (7) | 585.10 | 538.44 | 565.54 | 583.14 | 614.36 |
| Department of Energy and Climate (1) (7) | 418.74 | ||||
| Department of Environment, Science and Innovation (1) (7) | 2,913.74 | ||||
| Department of Housing, Local Government, Planning and Public Works (1) (7) | 3,735.04 | ||||
| Department of Justice and Attorney-General (4) | 3,362.89 | 3,364.76 | 3,467.23 | 3,681.86 | 4,071.62 |
| Department of Regional Development, Manufacturing and Water (3) (7) | 550.54 | 555.97 | 635.65 | 709.86 | |
| Department of Resources (7) | 1,480.24 | 1,358.65 | 1,380.14 | 1,466.43 | |
| Department of State Development and Infrastructure (1) (7) | 1,710.38 | ||||
| Department of the Premier and Cabinet (3) (7) | 457.51 | 395.32 | 412.86 | 475.75 | 460.74 |
| Department of Tourism and Sport (1) (7) | 440.37 | ||||
| Department of Transport and Main Roads (3) (7) | 7,231.94 | 7,338.20 | 7,414.92 | 7,672.64 | 9,668.72 |
| Department of Treaty, Aboriginal and Torres Strait Islander Partnerships, Communities and the Arts (2) (3) (7) | 710.90 | ||||
| Department of Youth Justice (1) (7) | 1,525.09 | 1,951.03 | |||
| Electoral Commission Queensland (7) | 75.95 | 62.50 | 63.83 | 73.35 | 91.37 |
| Office of the Inspector-General of Emergency Management (7) | 20.35 | 15.60 | 17.05 | 21.25 | 19.90 |
| Public Sector Commission (7) | 64.36 | 82.73 | |||
| Public Trustee (7) | 615.58 | 595.67 | 561.60 | 586.44 | 599.33 |
| Queensland Audit Office (7) | 197.60 | 187.58 | 192.08 | 185.22 | 197.86 |
| Queensland Corrective Services (7) | 5,241.80 | 5,919.83 | 6,467.65 | 6,608.94 | 7,129.74 |
| Queensland Fire and Emergency Services (7) | 3,339.66 | 3,374.83 | 3,607.42 | 3,766.69 | 3,954.82 |
| Queensland Health (4) (7) | 92,837.32 | 94,806.68 | 99,482.68 | 101,032.28 | 107,577.58 |
| Queensland Police Service (7) | 15,440.36 | 15,490.82 | 16,506.39 | 16,619.92 | 17,535.98 |
| Queensland Treasury (4) (7) | 980.13 | 1,092.28 | 1,153.10 | 1,307.66 | 1,413.66 |
| TAFE Queensland (7) | 4,045.57 | 4,062.41 | 4,219.66 | 4,329.83 | 4,439.24 |
| Department of Aboriginal and Torres Strait Islander Partnerships | 293.19 | ||||
| Department of Child Safety, Youth and Women | 3,354.39 | ||||
| Department of Children, Youth Justice and Multicultural Affairs (5) | 4,809.85 | 5,094.49 | 5,298.20 | ||
| Department of Communities, Disability Services and Seniors | 1,828.80 | ||||
| Department of Communities, Housing and Digital Economy (6) | 3,752.04 | 3,322.22 | 3,416.86 | ||
| Department of Energy and Public Works (5) | 1,558.93 | 2,069.98 | 2,190.34 | ||
| Department of Environment and Science (4) (5) | 2,946.59 | 2,684.52 | 2,724.64 | 2,924.38 | |
| Department of Housing and Public Works | 5,332.18 | ||||
| Department of Innovation and Tourism Industry Development | 166.02 | ||||
| Department of Local Government, Racing and Multicultural Affairs | 178.38 | ||||
| Department of Natural Resources, Mines and Energy | 2,439.46 | ||||
| Department of Seniors, Disability Services and Aboriginal and Torres Strait Islander Partnerships (6) | 1,909.66 | 1,818.24 | 1,808.30 | ||
| Department of State Development, Infrastructure, Local Government and Planning (3) (5) | 879.42 | 914.77 | 1,011.44 | ||
| Department of State Development, Manufacturing, Infrastructure and Planning | 911.39 | ||||
| Department of Tourism, Innovation and Sport (5) | 411.58 | 426.49 | 472.54 | ||
| Public Service Commission | 60.93 | 59.70 | 63.00 | ||
| Sector sub-total: Budget paper 2 agencies | 229,693.58 | 232,311.92 | 239,740.20 | 244,060.39 | 255,633.28 |
| Legal Aid Queensland (7) | 566.72 | 563.62 | 565.65 | 615.50 | 691.81 |
| Office of the Health Ombudsman (7) | 137.45 | 120.77 | 118.51 | 129.50 | 138.12 |
| Queensland Art Gallery (7) | 294.83 | 290.74 | 266.17 | 316.33 | 320.80 |
| Queensland Family and Child Commission (7) | 64.85 | 63.99 | 63.62 | 55.24 | 58.77 |
| Queensland Human Rights Commission (7) | 39.71 | 42.28 | 44.10 | 60.34 | 60.46 |
| Queensland Museum (7) | 260.93 | 250.37 | 266.83 | 278.16 | 274.24 |
| Resources Safety and Health Queensland (7) | 308.06 | 315.84 | 341.43 | 355.78 | |
| State Library of Queensland (7) | 282.35 | 275.04 | 265.23 | 294.16 | 293.94 |
| Trade and Investment Queensland (7) | 129.21 | 131.22 | 114.72 | 143.84 | 171.13 |
| Public Safety Business Agency | 1,084.21 | 1,089.71 | |||
| Sector sub-total: Other entities | 2860.26 | 3135.80 | 2020.67 | 2234.50 | 2365.05 |
| Norfolk Island Taskforce | 8.00 | 14.60 | 13.80 | ||
| Norfolk Island Taskforce | 8.00 | 14.60 | 13.80 | ||
| Whole of sector total | 232,553.84 | 235,447.72 | 241,768.87 | 246,309.49 | 258,012.13 |
Occupation type
Key frontline, frontline and frontline support roles
Key frontline, frontline and frontline support roles deliver services, programs and outcomes directly to the community, or provide essential support enabling the development and delivery of frontline services, programs and outcomes.
While people in frontline and key frontline roles engage directly with the community, frontline support roles provide essential support enabling the development and delivery of frontline services, programs and outcomes. Delivery can be via government centres, telephone, online or in the community.
Key frontline roles are those that are critical or essential in a community and include nurses, doctors, teachers, police, child safety case workers, youth case workers and correctional officers.
Corporate roles
Corporate roles provide organisation-wide support to the sector so that it can deliver the Queensland Government’s objectives for the community and frontline services. These roles include employees working in human resource management, accounts and finance, information technology and communication, events coordination and media management/communications.
9 out of 10 public service roles deliver directly to the Queensland community (March 2024).
The Queensland Government response to the COVID-19 pandemic impacted the sector composition. With the introduction of savings measures in July 2020 and the focus on the frontline response to the pandemic, growth in corporate roles slowed significantly and frontline roles increased.
Across 2023 and 2024 recruitment in corporate services increased. This represented a right-sizing of corporate roles following their decrease during the pandemic.
| Reporting year | Mar 2020 | Mar 2021 | Mar 2022 | Mar 2023 | Mar 2024 |
|---|---|---|---|---|---|
| Key frontline roles | 142,808.37 | 148,246.48 | 152,544.72 | 154,138.53 | 159,550.51 |
| Frontline and frontline support | 69,856.78 | 67,200.36 | 68,886.12 | 70,139.84 | 74,382.77 |
| Corporate | 19,888.69 | 20,000.88 | 20,338.03 | 22,031.12 | 24,078.85 |
In the twelve months between March 2023 and 2024, there was an increase in the number of FTE for corporate roles, frontline and frontline support roles, as well as key frontline roles.
| Occupation type FTE in past 12 months | Mar 2023 | Mar 2024 | Variance | % Variance |
|---|---|---|---|---|
| Key frontline roles | 154,138.53 | 159,550.51 | 5,411.98 | 3.51% |
| Frontline and frontline support | 70,139.84 | 74,382.77 | 4,242.93 | 6.05% |
| Corporate | 22,031.12 | 24,078.85 | 2,047.73 | 9.29% |
Source: MOHRI March 2023 and March 2024.
Diversity of roles
There are different key frontline, frontline and frontline support, and corporate roles.
There are 159,550.51 key frontline FTE in the Queensland public sector.
- Teachers and teacher aides: 59,288.54
- Nurses and midwives: 41,370.10
- Allied health (health practitioners, professional and technical): 16,155.93
- Ambulance officers: 5,231.88
- TAFE teachers and tutors: 2,141.86
- Child safety case workers: 1,940.05
- Disability support workers: 943.18
- Police: 11,890.69
- Correctional officers: 4,630.14
- Doctors: 12,105.29
- Firefighters: 2,816.51
- Youth and case workers: 1,036.34
Source: MOHRI March 2024.
For reporting purposes, a two-tier system is used to describe the workforce. The first tier of reporting applies the Australian and New Zealand Standard Classification of Occupations (ANZSCO). Introduced by the Australian Bureau of Statistics, ANZSCO is an industry standard coding system that attributes a six digit code to a position to describe the occupation being performed. This provides a uniform way for all organisations to categorise different types of roles.
Every position in the Queensland public sector is allocated a specific ANZSCO code when it is created.
The second tier describes the nature of the work undertaken in the role with each role being categorised as either frontline and frontline support roles or corporate roles.
Key frontline, frontline and frontline support roles
Overall, there has been a steady increase in the number of key frontline FTE over the past five years.
Most key frontline roles have increased in FTE numbers over the last five years.
The number of teacher aides declined in 2021 and 2022 in response to COVID-19 vaccination mandates.
The number of disability support workers have steadily decreased with the introduction of the National Disability Insurance Scheme.
| Key frontline roles | Mar 2021 | Mar 2022 | Mar 2023 | Mar 2024 |
|---|---|---|---|---|
| Ambulance officers | 2.26% | 5.36% | 2.90% | 5.64% |
| Child safety case workers | 0.29% | 5.79% | 1.10% | 5.20% |
| Correction officers | 27.16% | 13.95% | 1.14% | 6.52% |
| Disability Support Workers | -3.88% | -9.50% | -4.51% | -0.23% |
| Doctors | 3.77% | 2.45% | 2.73% | 6.77% |
| Firefighters | 2.80% | 1.24% | 3.10% | 4.74% |
| Health practitioners/Professional/Technical | 21.69% | 5.54% | 1.33% | 6.59% |
| Nurses and midwives | 3.03% | 6.14% | 1.53% | 5.69% |
| Police | 1.06% | 0.04% | -0.49% | -0.14% |
| TAFE teachers and tutors | 1.73% | 3.26% | 2.62% | 5.88% |
| Teacher aides | -0.23% | -0.49% | 0.88% | 0.15% |
| Teachers | 0.71% | 0.26% | 0.33% | 0.94% |
| Youth and case workers | 4.93% | 9.01% | 1.63% | 6.82% |
In this report, numbers reported for the key frontline police officers does not include the police recruits. In the past 12 months, the number of police recruits have almost doubled. This brings the number of police recruits to 558 as at March 2024.
The number of key frontline, frontline and frontline support has increased each year between March 2020 and March 2024. There has been a particularly notable increase between March 2023 and March 2024.
Between March 2022 and March 2023 the number of key frontline, frontline and frontline support roles increased by 1.29%. Between March 2023 and March 2024 the number of key frontline, frontline and frontline support roles increased by 4.30%.
Examples of other frontline and frontline support roles are:
- social workers
- public prosecutors, bailiffs, clerks of court and court registry officers
- front counter and customer enquiry employees, call centre and online customer service employees in Queensland Government service centres
- school crossing supervisors, art gallery and museum curators and guides, archivists, librarians
- mine inspectors, park rangers, fisheries officers, road engineers, surveyors, regulatory inspectors, quarantine officers
- earth science, environmental and agricultural scientists/officers, laboratory technicians, marine biologists, geologists
- builders, electricians and other construction industry tradespersons
- radio dispatchers
- recreation facilitators and instructors
- grants management officers
- hospital and health service employees (non-corporate roles)
- school employees
- prison and community corrections employees
- clerical and administrative support employees in police, fire or ambulance stations and other centres accessible by the community for government services
- program or project planners, administrators, managers and strategy employees who formulate public policies for the provision of government services, programs and outcomes affecting communities (e.g. fisheries, forestry, waste management, public health, youth programs, tourism, environment, planning services and systems, economic strategy and industry development).
| Key frontline, frontline/frontline support FTE | Mar 2024 |
|---|---|
| Ambulance officers | 5,231.88 |
| Child safety case workers | 1,940.05 |
| Clerical and office support workers | 1,005.78 |
| Commercial cleaners | 4,730.59 |
| Correction officers | 4,630.14 |
| Disability support workers | 943.18 |
| Doctors | 12,105.29 |
| Firefighters | 2,816.51 |
| Gardeners (General) | 1,202.36 |
| General clerks | 14,966.78 |
| Health practitioners/professional/technical | 16,155.93 |
| Information officers | 1,223.19 |
| Labourers | 3,614.99 |
| Nurses and midwives | 4,1370.1 |
| Office manager | 2,467.14 |
| Police | 11,890.69 |
| Policy analysts | 1,243.11 |
| Policy and planning managers | 1,651.62 |
| Program or project administrator | 4,749.95 |
| Security officers | 1,094.22 |
| Specialist managers | 1,327.06 |
| TAFE teachers and tutors | 2,141.86 |
| Teacher aides | 10,805.38 |
| Teachers | 48,483.16 |
| Waiters | 1,114.45 |
| Youth and case workers | 1,036.34 |
| Role category with less than 1000 FTE in role category | 33,991.53 |
| Total FTE | 233,933.28 |
Source: MOHRI 2024.
| Reporting year | Mar 2021 | Mar 2022 | Mar 2023 | Mar 2024 |
|---|---|---|---|---|
| Ambulance officers | 2.26% | 5.36% | 2.90% | 5.64% |
| Child safety case workers | 0.29% | 5.79% | 1.10% | 5.20% |
| Clerical and office support workers | ||||
| Commercial cleaner | 10.01% | -0.59% | -5.49% | 2.56% |
| Correction officers | 27.16% | 13.95% | 1.14% | 6.52% |
| Disability support workers | -3.88% | -9.50% | -4.51% | -0.23% |
| Doctors | 3.77% | 2.45% | 2.73% | 6.77% |
| Firefighters | 2.80% | 1.24% | 3.10% | 4.74% |
| Gardeners (general) | -3.61% | 0.78% | -0.28% | 1.34% |
| General clerks | -2.53% | 4.96% | -0.77% | 3.59% |
| Health practitioners/professional/technical | 21.69% | 5.54% | 1.33% | 6.59% |
| Information officers | -4.52% | -7.49% | 5.34% | -7.16% |
| Labourers | -2.62% | 11.27% | 2.44% | 3.21% |
| Nurses and midwives | 3.03% | 6.14% | 1.53% | 5.69% |
| Office managers | -2.89% | 1.14% | 3.31% | 5.33% |
| Police | 1.06% | 0.04% | -0.49% | -0.14% |
| Policy analysts | -13.76% | 0.11% | 11.12% | 7.42% |
| Policy and planning managers | 6.96% | 3.37% | 24.88% | 11.36% |
| Program or project administrators | -1.41% | 3.89% | 12.79% | 8.85% |
| Security officers | 0.25% | 8.64% | ||
| Specialist managers | 9.26% | |||
| TAFE teachers and tutors | 1.73% | 3.26% | 2.62% | 5.88% |
| Teacher aides | -0.23% | -0.49% | 0.88% | 0.15% |
| Teachers | 0.71% | 0.26% | 0.33% | 0.94% |
| Waiters | -1.67% | -0.54% | 5.93% | 1.12% |
| Youth and case workers | 4.93% | 9.01% | 1.63% | 6.82% |
| Role category with less than 1000 FTE in role category | -6.47% | -1.30% | -2.33% | 4.90% |
| Total | 1.31% | 2.78% | 1.29% | 4.30% |
Blank cells mean there were either no employees in the relevant category in the prior years, or there were employees <1000 and these have been rolled up into the <1000 category.
Source: MOHRI 2020-2024.
Police recruitment
- The Queensland Police Service launched an extensive recruitment campaign in 2023, providing a range of recruitment pathways and entry incentives to increase their workforce.
- The campaign includes potential HECS debt payments of up to $20,000 for graduates with degrees in areas such as criminology, social work, counselling and other relevant human services, and a potential $20,000 incentive payment for recruits with overseas or interstate police experience.
- As a result of the campaign, the number of police recruits in the MOHRI data set has almost doubled in the past 12 months from 284 in March 2023 to 558 in March 2024.
- MOHRI data does not capture the number of police recruits in the pipeline from application to graduation. The number of applicants in the pipeline has doubled over a 12 month period, with 960 in the pipeline in April 2023 compared with 2,079 in April 2024.
Corporate service roles
Corporate roles provide organisation-wide support to the sector so that it can deliver the Queensland Government’s objectives for the community – good jobs, better services and great lifestyle.
Corporate services roles make up a small proportion of the Queensland public sector. There are 24,078.85 corporate FTE roles in the Queensland public sector. These roles provide vital services that support and enable key frontline and frontline staff to deliver to the community.
Growth in corporate service roles was relatively slow until 2022, as the sector recovered from the COVID-19 pandemic. With the notable increase in frontline roles, the number of corporate service FTE has also picked up in recent years.
| Corporate service roles FTE | Mar 2024 |
|---|---|
| Accounting and finance | 3,393.56 |
| Audit services | 310.90 |
| Communication, media and marketing | 1,250.15 |
| Corporate services management | 686.52 |
| Executive services and support | 1,415.52 |
| Governance and strategy | 1,439.06 |
| Human resources | 4,874.46 |
| Information and communications technology | 6,332.37 |
| Information management | 1,022.45 |
| Legal services | 430.40 |
| Procurement and contract management | 1,287.91 |
| Property and facilities | 1,635.55 |
| Total FTE | 24,078.85 |
Source: MOHRI 2024.
| Corporate service roles | Mar 2021 | Mar 2022 | Mar 2023 | Mar 2024 |
|---|---|---|---|---|
| Accounting and finance | 1.03% | -1.64% | 4.56% | 4.39% |
| Audit services | -3.75% | -0.90% | 3.10% | 2.46% |
| Communication, media and marketing | -2.20% | 0.64% | 11.52% | 5.04% |
| Corporate services management | -1.49% | 62.16% | 29.11% | 53.14% |
| Executive services and support | 2.09% | -0.22% | 26.82% | 9.16% |
| Governance and strategy | 3.15% | 6.48% | 19.82% | 13.02% |
| Human resources | -0.34% | 4.04% | 0.19% | 10.25% |
| Information and communications technology | 1.94% | -1.72% | 17.61% | 10.29% |
| Information management | 0.64% | 1.62% | 8.76% | 8.47% |
| Legal services | -3.90% | -2.34% | 9.18% | 3.12% |
| Procurement and contract management | 3.21% | 0.02% | -6.07% | 0.66% |
| Property and facilities | -3.06% | 6.87% | -4.12% | 11.57% |
| Total | 0.56% | 1.69% | 8.32% | 9.29% |
Source: MOHRI 2020–2024.
In some cases employees are performing corporate type roles that are classified as frontline/frontline support because the role provides essential support enabling the development and delivery of frontline services, programs and outcomes. In these instances, the support provided by the corporate role, to the frontline employees, is critical in enabling services to be delivered to the community at the frontline.
Examples include:
- general clerks, including:
- officers directly supporting child safety case workers for meetings with children and families
- officers supporting seniors and carers in relation to cost of living concessions
- officers providing services in call centres or customer service centres
- people working in the administrative offices of Queensland state schools
- ICT technicians assisting teachers in school computer labs and libraries, or implementing public facing systems such as public transport ticketing systems
- professional trainers coaching employees such as firefighters, police officers, emergency workers, disability support workers, child safety case workers and community recovery workers
- communication professionals providing messages on public safety communication channels warning the community of potential disaster situations.
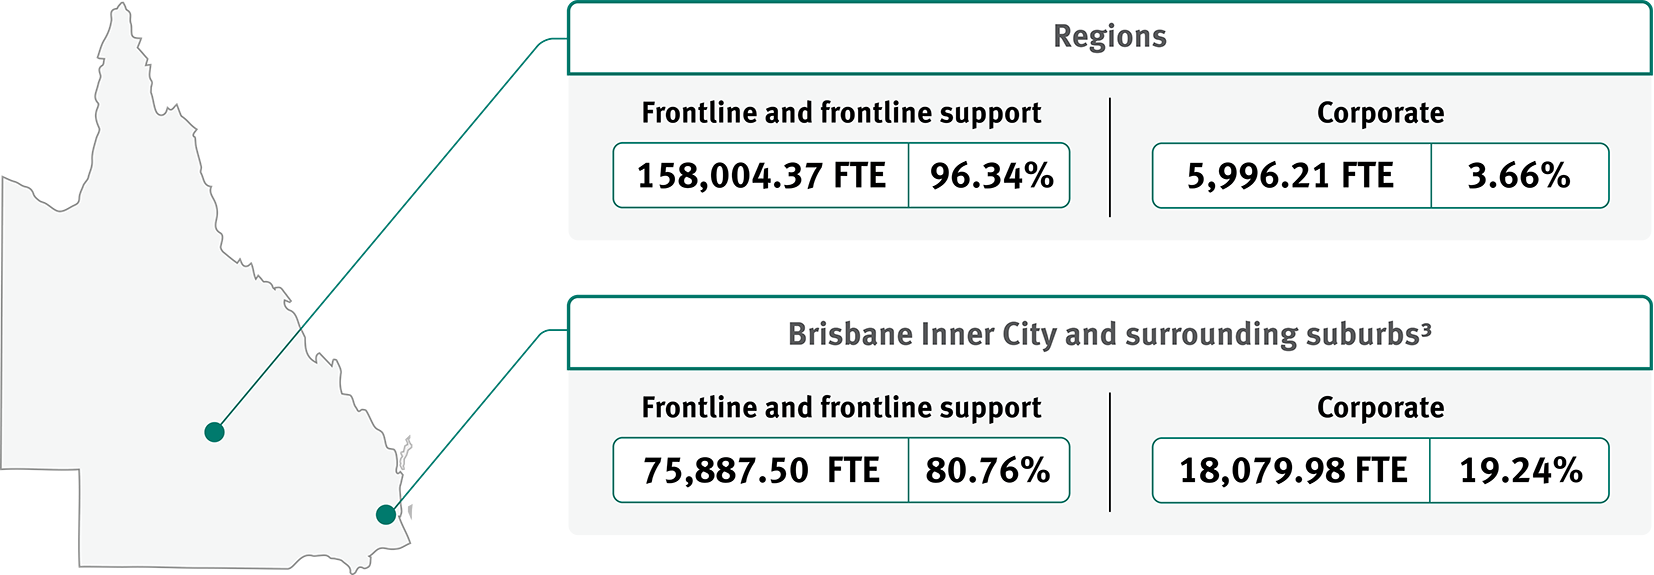
Location 2
The number of FTE based in both Brisbane Inner City and surrounding suburbs as well as regional locations across the state, has steadily increased in the past five years.
FTE numbers across the state have increased notably between 2023 and 2024. While this upward trend is the case for total FTE, it is also the trend for both corporate roles and frontline (including key frontline) and frontline support roles.
FTE across all locations has increased over the five years to March 2024.
Close to 20.7% of FTE are located in the Brisbane Inner City statistical area, with 15.7% of FTE working in Brisbane North, East, South, West. There are 63.6% FTE working in the regions.
Brisbane remains the administrative or corporate heart of the Queensland public sector.
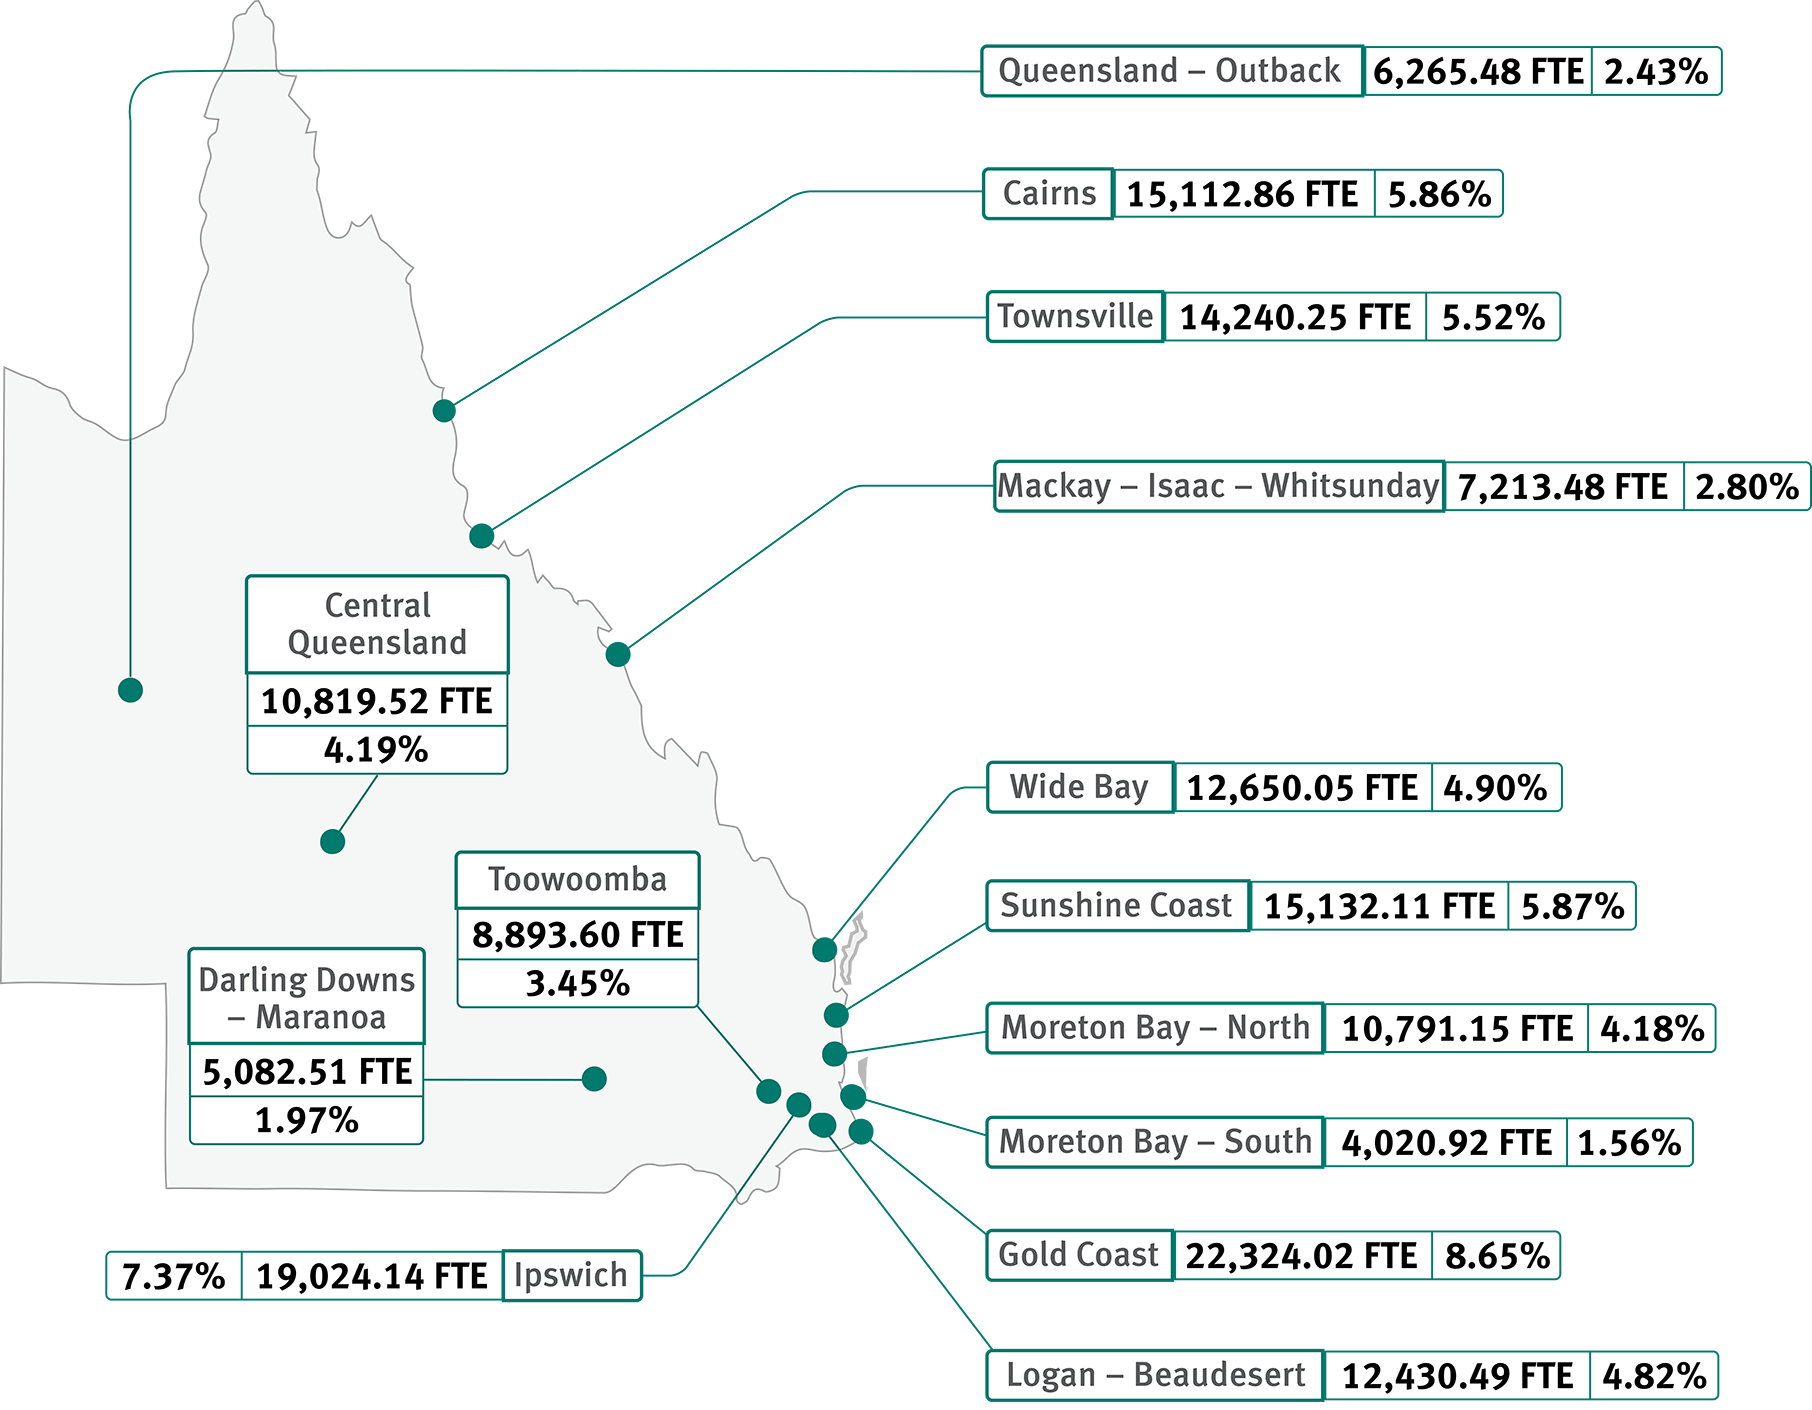
Regionally-based FTE as % of total sector workforce
Outside of the Brisbane Inner City statistical area, sector workers are concentrated in several key regional centres.
| Key frontline/frontline/frontline support | Corporate roles | Total | % of total public sector workforce | |||
|---|---|---|---|---|---|---|
| Brisbane – East | 5,836.88 | 99.01% | 58.09 | 0.99% | 5,894.97 | 2.29% |
| Brisbane – North | 9,823.36 | 92.33% | 816.21 | 7.67% | 10,639.57 | 4.12% |
| Brisbane – South | 18,875.65 | 93.76% | 1255.71 | 6.24% | 20,131.36 | 7.80% |
| Brisbane – West | 3,824.95 | 99.32% | 26.38 | 0.68% | 3,851.33 | 1.49% |
| Brisbane Inner City | 37,526.66 | 70.21% | 15,923.59 | 29.79% | 53,450.25 | 20.72% |
| Cairns | 14,416.30 | 95.39% | 696.56 | 4.61% | 15,112.86 | 5.86% |
| Central Queensland | 10,328.92 | 95.47% | 490.60 | 4.53% | 10,819.52 | 4.19% |
| Darling Downs – Maranoa | 4,957.90 | 97.55% | 124.61 | 2.45% | 5,082.51 | 1.97% |
| Gold Coast | 21,505.16 | 96.33% | 818.86 | 3.67% | 22,324.02 | 8.65% |
| Ipswich | 18,513.22 | 97.31% | 510.92 | 2.69% | 19,024.14 | 7.37% |
| Logan – Beaudesert | 12,104.35 | 97.38% | 326.14 | 2.62% | 12,430.49 | 4.82% |
| Mackay – Isaac – Whitsunday | 6,955.63 | 96.43% | 257.85 | 3.57% | 7,213.48 | 2.80% |
| Moreton Bay – North | 10,611.65 | 98.34% | 179.50 | 1.66% | 10,791.15 | 4.18% |
| Moreton Bay – South | 3,982.42 | 99.04% | 38.50 | 0.96% | 4,020.92 | 1.56% |
| Queensland – Outback | 6,050.30 | 96.57% | 215.18 | 3.43% | 6,265.48 | 2.43% |
| Sunshine Coast | 14,457.11 | 95.54% | 675.00 | 4.46% | 15,132.11 | 5.87% |
| Toowoomba | 8,393.04 | 94.37% | 500.56 | 5.63% | 8,893.60 | 3.45% |
| Townsville | 13,480.00 | 94.66% | 760.25 | 5.34% | 14,240.25 | 5.52% |
| Wide Bay | 12,248.37 | 96.82% | 401.68 | 3.18% | 12,650.05 | 4.90% |
Source: MOHRI 2024.
Employment type
Appointment type
Most Queensland public sector employees are employed on a permanent basis. The proportion of permanent employment in the sector has increased over the past five years.
| Appointment type | FTE: March 2024 |
|---|---|
| Permanent | 214,032.42 |
| Temporary | 34,392.39 |
| Casual | 7,354.29 |
| Contract | 2,233.03 |
| Total | 258,012.13 |
Source: MOHRI 2024.
Employment status
Most of Queensland’s public sector employees are employed in full-time roles. Employment status has been relatively consistent over the past five years.
| Employment status | Headcount: March 2024 |
|---|---|
| Full-Time | 187,734 |
| Part-Time | 99,708 |
| Casual | 20,591 |
| Total | 308,033 |
Source: MOHRI March 2024.