Enterprise architecture mapping
Within the Digital and ICT planning framework, this guideline this guideline describes how to map relationships between elements within a layer of an enterprise architecture or across multiple layers of an enterprise architecture.
Mapping refers the activity of identifying and documenting the relationships between elements within a layer of an enterprise architecture or across layers of an enterprise architecture.
Mappings can be used to ensure all necessary information about a current state of the planning organisation has been gathered prior to the commencement of the planning activity. For example, gaps may highlight the scope of the applications collected is not consistent with the scope of business processes collected.
Mapping helps practitioners and business representatives gain an understanding of:
- the current state of an organisation’s business strategic direction, services provided and supporting business processes, information, applications, and underpinning technology
- what is important to the business’s direction
- the information, applications, and technology assets or services that the business relies on for service delivery
- where changes to the current state including new business and technology capability may impact other parts of the business.
The analysis of mapping may result in actions that can be carried forward into the planning activities with the business. It should be noted some mapping relationships are required for whole-of-government reporting purposes.
Audience
A practitioner in the context of this guideline can include one or more of the following roles:
- Enterprise architects
- Digital and ICT strategic planners
- Agency and service strategic planners
- Business analysts.
Before conducting any mapping activities, the practitioner should engage with the business planning unit, the Queensland Government Enterprise Architecture (QGEA) team or other business stakeholders within the organisation to identify which elements relevant to the planning engagement may have already been mapped.
The Queensland Government ICT Profiling standard describes the mapping relationship that are required for whole-of-government reporting purposes.
It is usual for an organisation to have clearly defined relationships between the objectives, key performance indicators and business strategies as part of the organisation strategic planning process.
Mapping should only be conducted once the practitioner is satisfied all relevant elements have been gathered and documented in the relevant registers including:
- Business direction register
- Business service register
- Business process register
- Information assets register
- Application assets register
- Technology assets register.
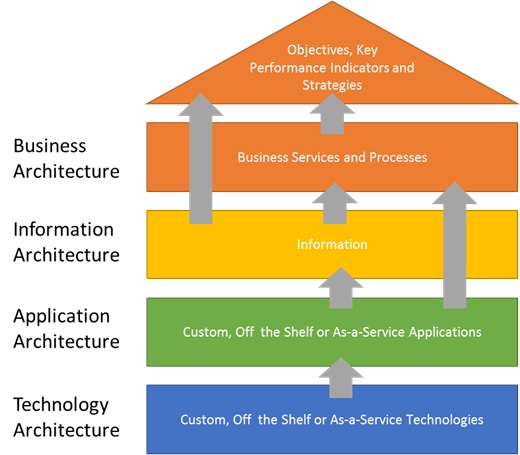
Mapping involves identifying the relationships between elements either within or across a layer of an enterprise architecture. The diagram below demonstrates the concept of mapping with respect to the Queensland Government Enterprise Architecture (QGEA).
Mapping across layers is generally conducted from one layer to the layer above in an enterprise architecture. For example, business objectives can map to strategies or services to business processes or across one or more layers of an enterprise architecture such as application to information and business processes.
The extent to which mapping is conducted will depend on the scope of the planning engagement and the information available. For a large agency, it may not be feasible to map all the relationships. It may be reasonable to focus on business strategic directions and core services of the agency and map only the relationships between the business strategic direction and services, services and information as well as services and applications.
Digital and ICT planning framework mappings
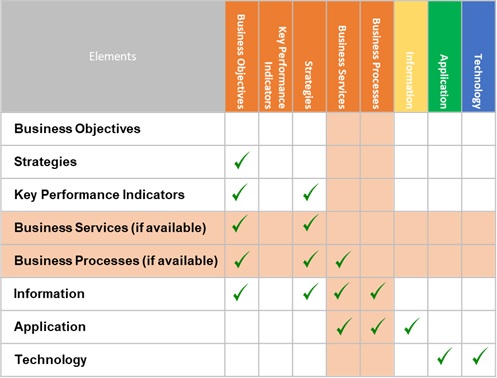
The table below outlines the recommended mapping combinations for conducting digital and ICT strategic planning. It demonstrates the high concentration of mapping in the strategy and business layers. This confirms the value of mapping to understanding the business of the planning organisation in terms of its strategic direction and services.
It’s important to note there is not always a logical or valid combination between all elements. Not all possible mappings between the information gathered will yield a result which is useful for analysis.
For smaller planning engagements (e.g. a single business area), conducting all recommended mappings helps ensure both the practitioner and the business has a thorough understanding of the business direction, services, processes, information, applications and technology capability of the organisation prior to commencing the planning engagement.
For larger planning engagements that cover the entire agency it may only be possible to map the relationships between the strategic elements and the relationships between information, applications and technologies.
Practitioners should review the information currently available in your organisation. As a planning or architecture team, you should agree on the mappings that represent the greatest value given the information available. Ask yourself, where there are gaps information, determine how gaps can be addressed and how the scope of mapping could be increased to provide additional value in the future?
Within the digital and ICT planning framework the resulting relationships between elements are classified as a gap, supported, highly supported, highly supporting or not supporting. This is determined by the proportion of mappings (zero, one to one or a one to many) and the nature of the relationship as either being a ‘supported by’ or ‘supporting’ relationship.
Planning actions resulting from mapping
The table below shows the recommended actions practitioners should take to ensure consistency in the scope of information collected prior to analysing the results of mapping at the agency or business area level.
The definitions listed below describe the different type of mapping result to be analysed:
- Gap—a business process is not supported by an application this may represent a gap if the business process is not a manual process.
- Supported—a business process is supported by one application.
- Highly supported—a business process is supported by multiple applications.
- Highly supporting—an application is supporting more than one business process.
- Not supporting—an application is not supporting any business processes.
| Result | Description | Recommended action |
|---|---|---|
| Gaps | One element not supported by any other |
|
| Supported | One element supported by only one other element. |
|
| Highly supported | One element supported by many other elements. |
|
| Highly supporting | One element supporting many other elements. |
|
| Not supporting | One element not supporting any other element. |
|
Strategic Opportunities Arising from Mapping
The following table describes the significance of the Gap, Supported, Highly supported, Highly supporting or Not supporting relationships at an agency or business area level.
Analysis of mapped relationships explained in the table can be used to identify potential strategies that can be carried forward for consideration by the business as part of the digital and ICT planning engagement.
| Results | Description | Strategic opportunity |
|---|---|---|
| High proportion of gaps | One element not supported by any other | Depending on context, this may not be an issue but may indicate missed elements in the data gathering activities. Gaps may be genuine. In these circumstances, new initiatives may arise that include the implementation/development of new services or ICT capability. |
| High proportion of supported | One element supported by only one other element. | This is generally considered normal and acceptable but may indicate a critical dependency on certain elements or a single point of risk exposure that needs to be managed. |
| High proportion of highly supported | One element supported by many other elements. | When mappings relate to ICT assets and services, such as applications and technologies, opportunities may exist to rationalise the portfolio of assets and services. |
| High proportion of highly supporting | One element supporting many other elements. | This is considered normal but may indicate a significant dependency on some elements depending on the context. This represents a single point of risk exposure that needs to be managed. |
| High proportion of not supporting | One element not supporting any other element. | When mappings relate to ICT asset and services this may indicate information, applications or technologies are no longer required. In these circumstances, initiatives may arise that retire some assets and services and rationalise the portfolio. |
Mapping business services or processes
A service or business process that is supported by a number of applications may present a strategic opportunity for application rationalisation or more integrated approaches between applications to better support he business process. A business process or service is not supported by an application may represent a new digital or ICT investment opportunity.
The results of the analysis of mappings can be presented back to the planning sponsor as well as the business representatives as part of the planning workshops during the planning engagement.
How to present mapping results
Mappings can be represented as diagrams that demonstrate the relationships between elements or graphs that demonstrate a high dependency between elements.
A graph or mind map can be used to show the number of information assets or applications supporting the significant or priority services of the agency or business unit.
It may be appropriate to suggest recommended management strategies that should be considered when developing the digital or ICT strategy or plan document. Alternatively, recommendations may need to be carried forward into operational planning activities.

